
Challenge
Solution
Result
How did we run our A/B test?
The 3 KPIs That Actually Predict Bottom Line Revenue
These KPIs formed the foundation of the BWH Plant Co. test when evaluating Retentics against their previous flow setup.
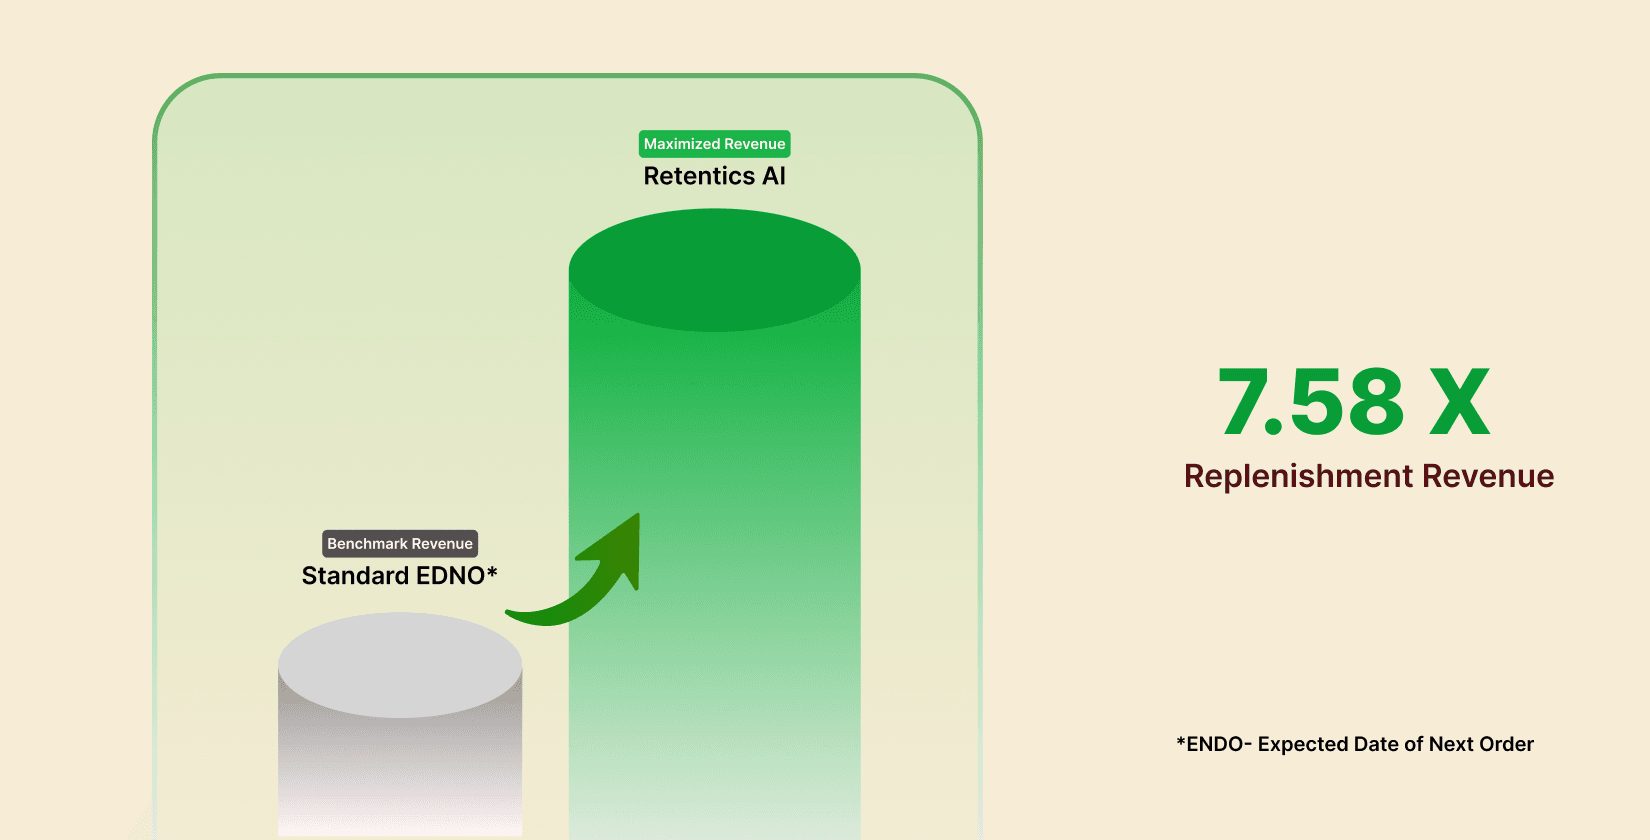
KPI 1: Replenishment Revenue Multiple
What is it: The ratio of revenue generated by our replenishment flow compared to the old flow over the same time period.
Why it matters: This shows if the “timing” logic actually works. A high multiple means you’re hitting the customer exactly when they are ready to buy.
The BWH Result: 7.58x Multiple Retentics generated 7.58x more replenishment revenue than the previous flow setup during the test window.
KPI 2: First Purchase Bounce Back Lift
What is it: The multiplier of revenue generated specifically from the second purchase window.
Why it matters: Capturing interest strategically after the first order is the most effective way to earn more revenue on the front end and scale long-term customer value (LTV).
The BWH Result: 2.43x Multiple. Retentics outperformed the previous flow setup by more than double for the post-first-purchase window.
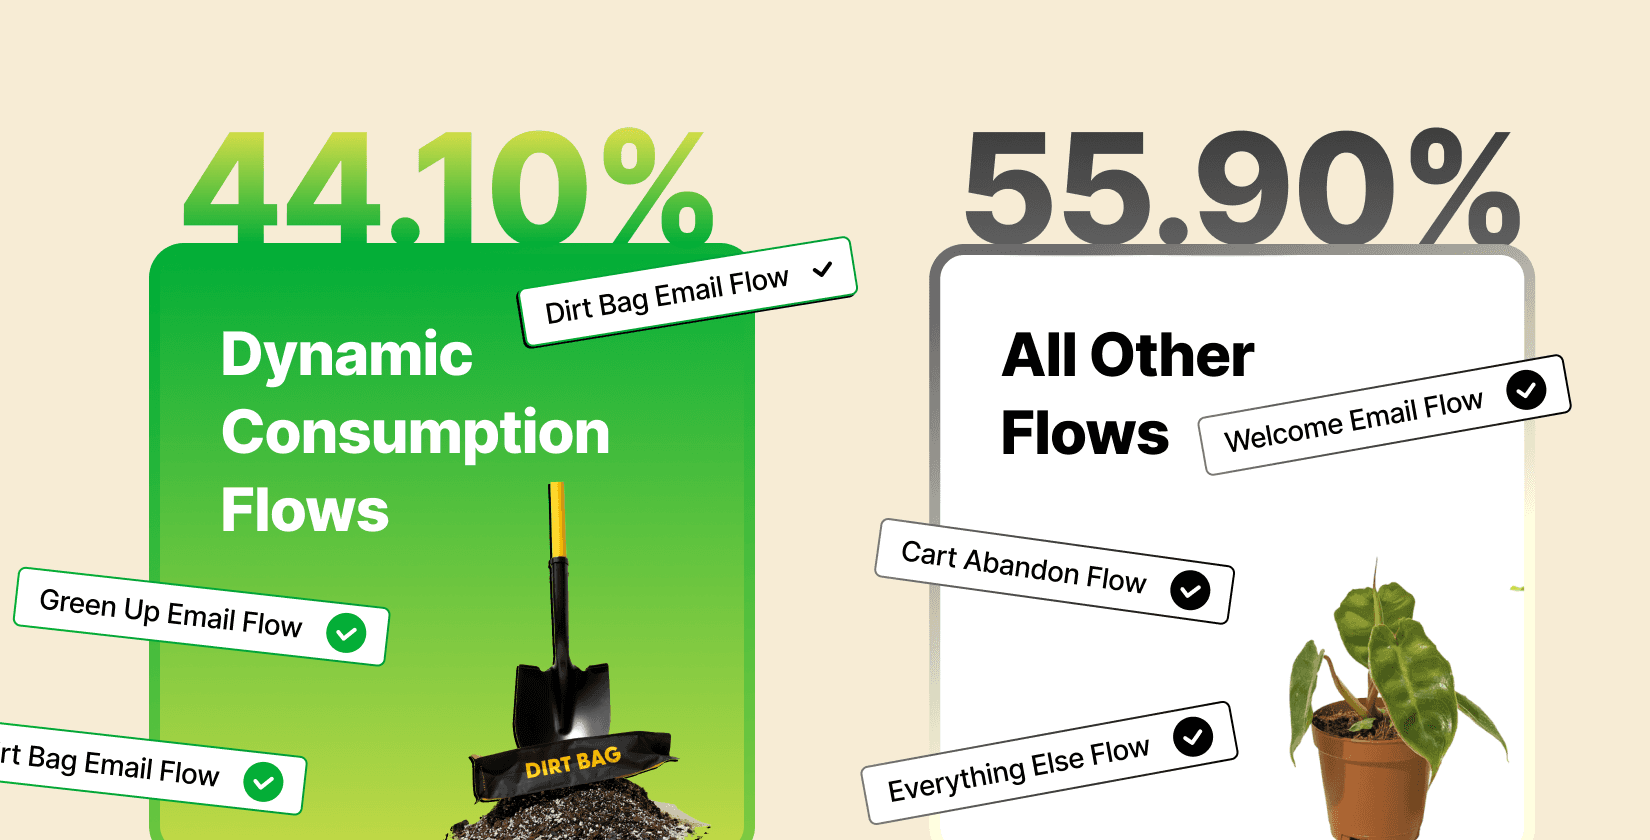
KPI 3: Flow Revenue Share
What is it: The percentage of total flow revenue generated by the optimized touchpoints.
Why it matters: This shows the dominance of our flows. Seeing how well our flows rank compared to their other flows (welcome, abandoned cart, etc.) helps put our results into perspective.
The Clarification: This 44% share represents a lift in total flow revenue — meaning Retentics grew the overall pie rather than just shifting attribution away from other flows.
The BWH Result: 44.10% Flow Share Our flows accounted for 44.10% of all flow revenue during the test period, proving that AI-based segmentation and personalization carries nearly half the weight of their entire email flow setup.
Visualizing Behavioral Analysis
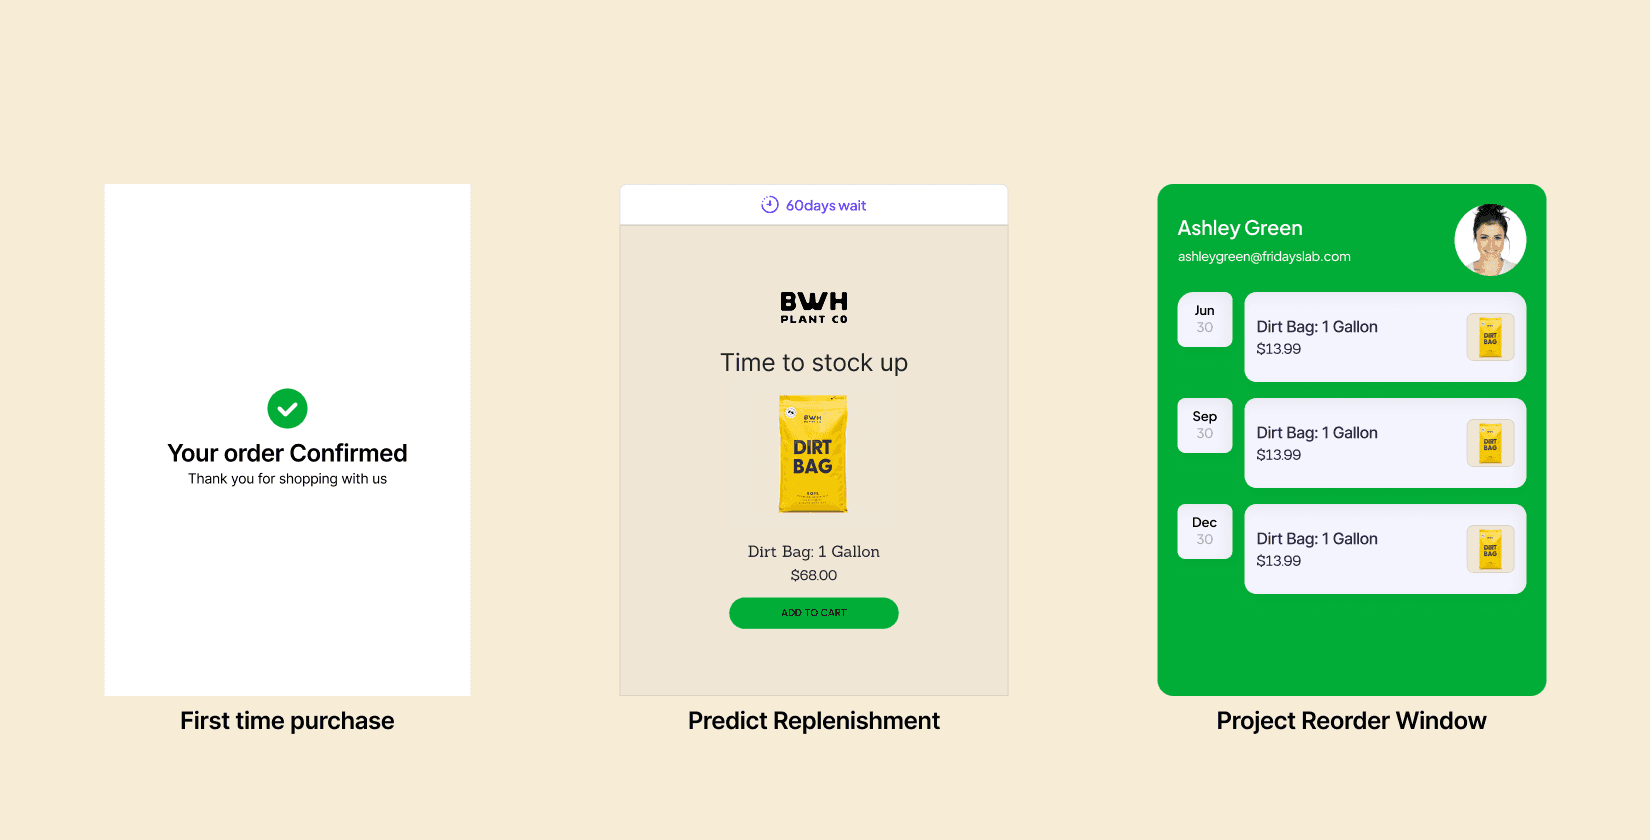
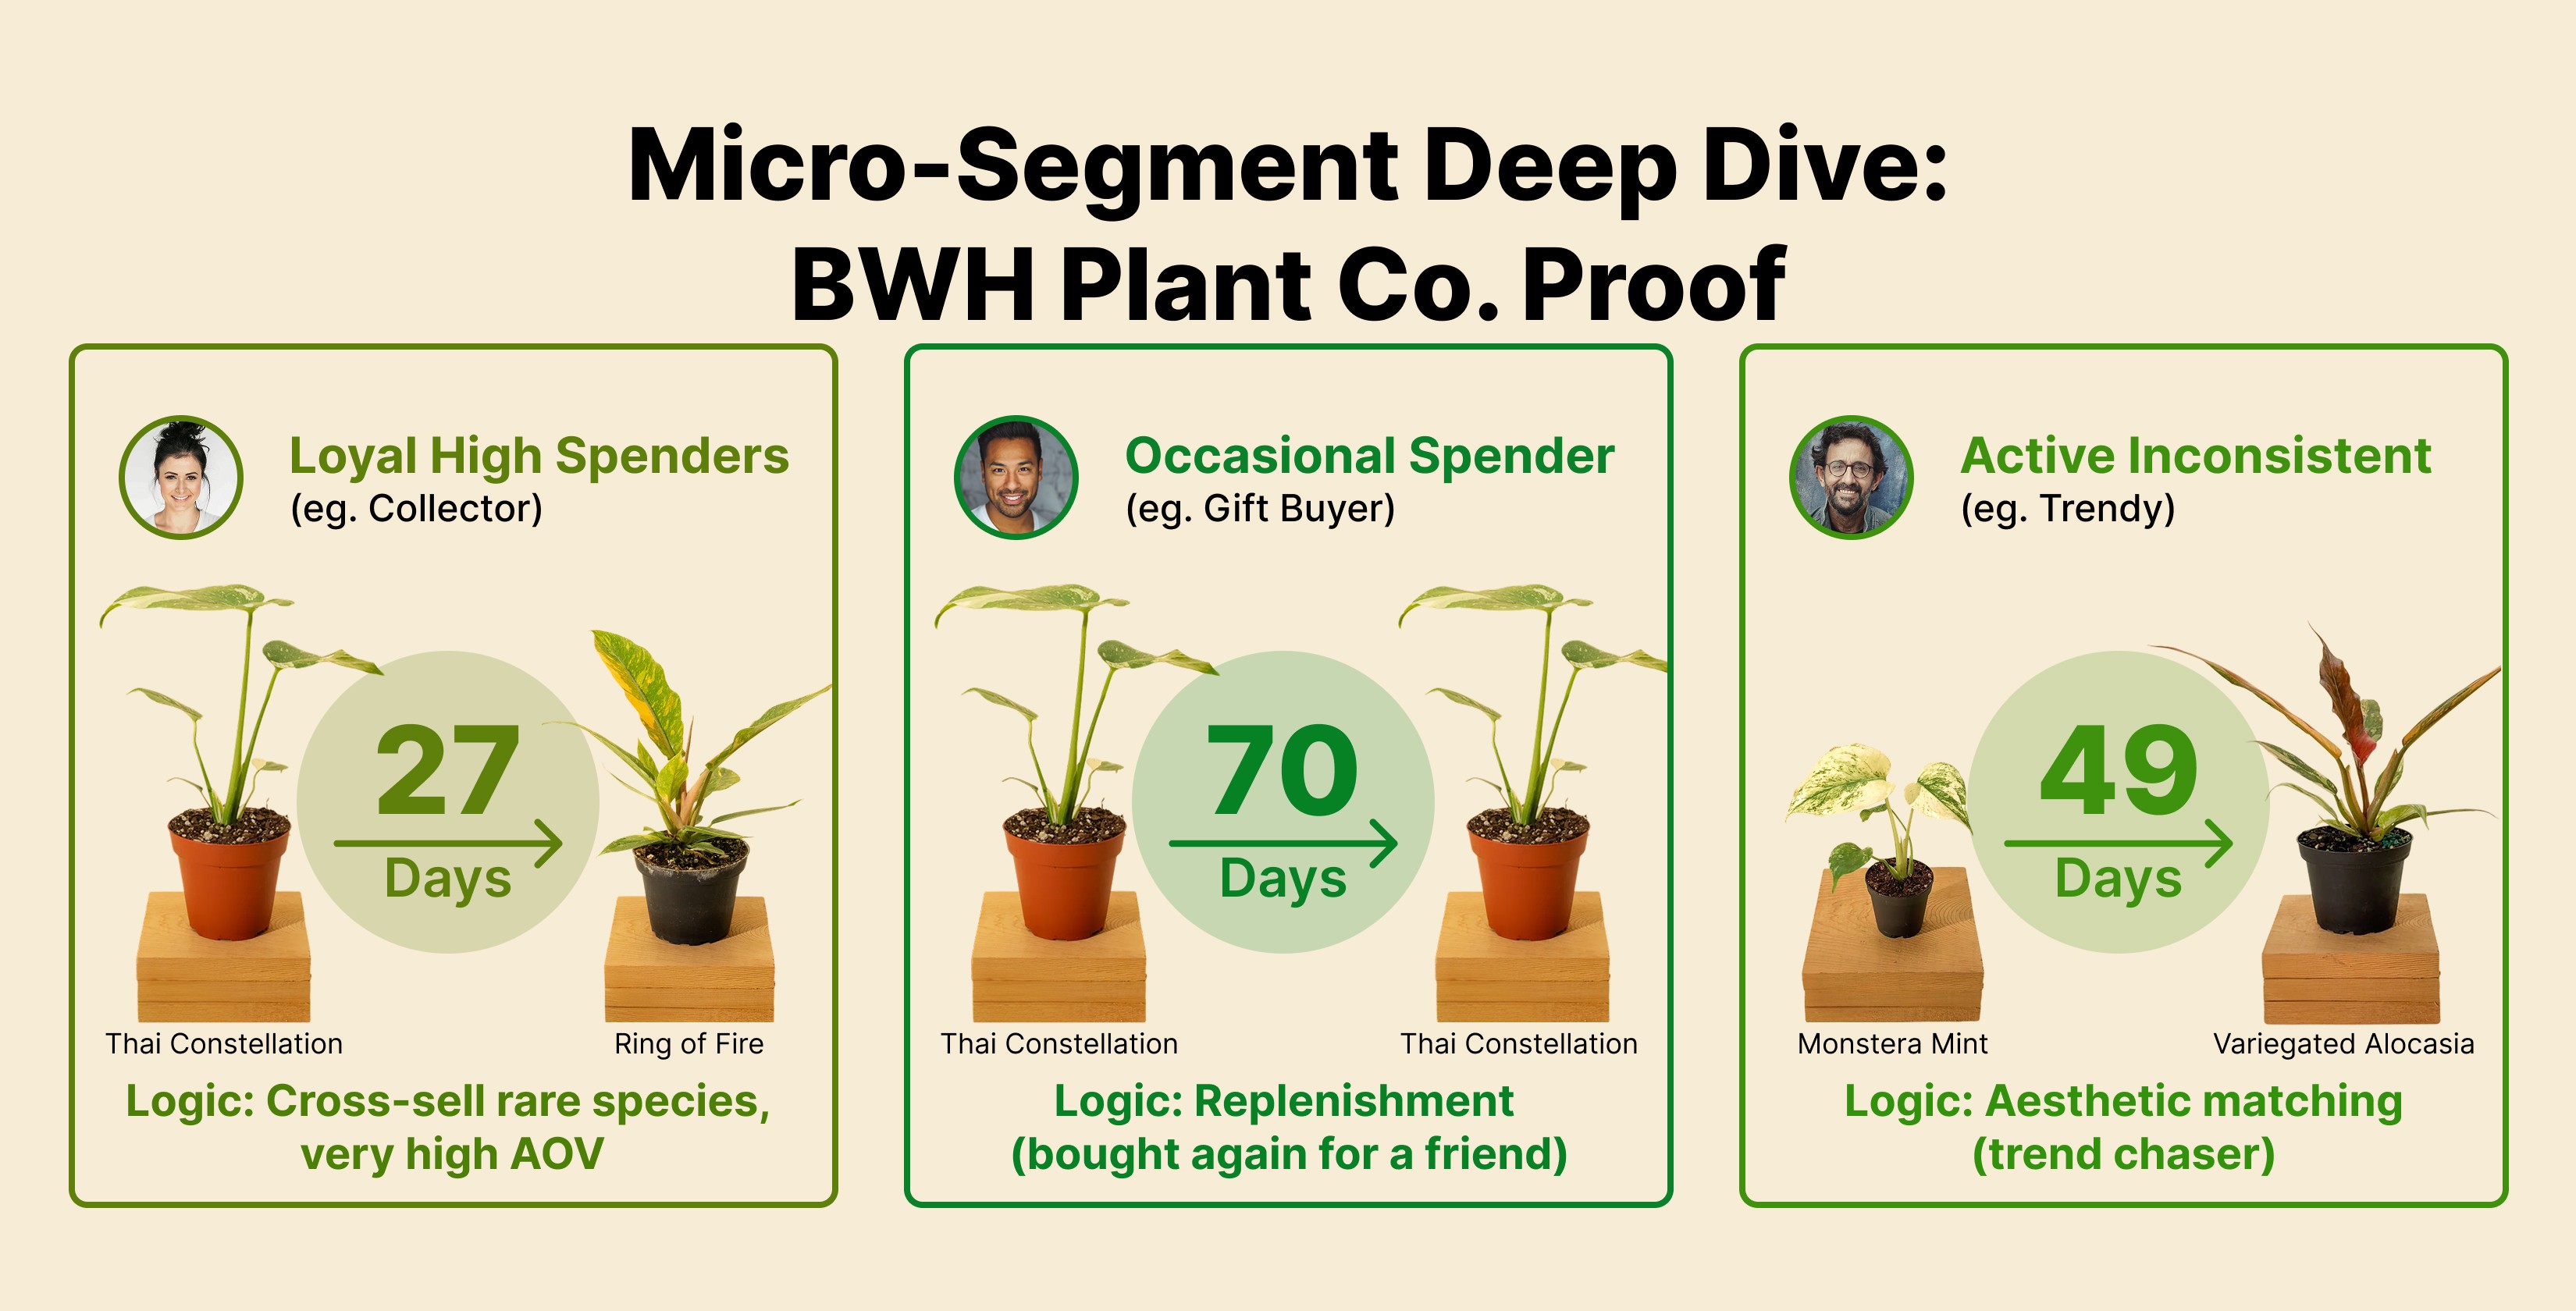
Retentics doesn't just guess; it identifies the natural purchase rhythms of BWH Plant Co.’s customers. While we track many distinct micro-segments, here is a look at 3 primary cohorts — from orders 1 to 2 — and the predictive logic that drives their replenishment cycles:
Why "Timing" Beats "Item-Level" Tracking
You’ll notice that a "Loyal High Spender" might move from a Thai Constellation to a Ring of Fire in under a month. Specifically — from orders 1 to 2 — our logic identifies that they enter a "buying mode" in 27 days. For each cohort, as the purchasing count increases, new products and time delays are predicted dynamically.
Even if a customer "leaks" and chooses a different plant than predicted, being present in the inbox during their natural purchase window is what captures the conversion. We don’t just track what they buy; we track the pulse of when they are ready to buy again.
The Key Health Metric: Projected Annual ROI
Projected Annual ROI
The BWH Result: 26.23x ROI
Why it matters: Based on the annual revenue projection against our plugin cost, we are delivering a 26.23x return. This shifts the conversation from "software cost" to "profit generation."
Final Advice
What matters is how many successful repeat purchases your flows produce, and how consistently they do so. After supporting the BWH Plant Co. migration, one pattern showed up clearly: generic timers lead to missed opportunities, while data-driven timing reveals where real profit is created.